Multiple Choice
Figure 9-8.On the diagram below,Q represents the quantity of cars and P represents the price of cars. 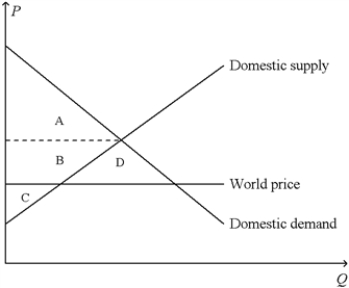
-Refer to Figure 9-8.The price corresponding to the horizontal dotted line on the graph represents the price of cars
A) after trade is allowed.
B) before trade is allowed.
C) that maximizes total surplus when trade is allowed.
D) that minimizes the well-being of domestic car producers when trade is allowed.
Correct Answer:
Verified
Related Questions

