Figure 9-29
The following diagram shows the domestic demand and domestic supply curves in a market.Assume that the world price in this market is $1 per unit. 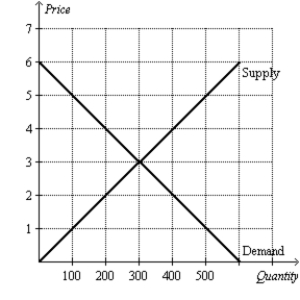
-Refer to Figure 9-29.Suppose the country imposes a $1 per unit tariff.If the country allows trade with a tariff,how much is the deadweight loss caused by the tariff?
Correct Answer:
Verified
View Answer
Unlock this answer now
Get Access to more Verified Answers free of charge
Q36: Figure 9-28
The following diagram shows the domestic
Q37: Figure 9-29
The following diagram shows the domestic
Q38: Figure 9-28
The following diagram shows the domestic
Q39: Scenario 9-3
Suppose domestic demand and domestic supply
Q40: Figure 9-27
The following diagram shows the domestic
Q42: Figure 9-29
The following diagram shows the domestic
Q44: Figure 9-29
The following diagram shows the domestic
Q45: Figure 9-29
The following diagram shows the domestic
Q46: Figure 9-29
The following diagram shows the domestic
Q112: List five arguments given to support trade
Unlock this Answer For Free Now!
View this answer and more for free by performing one of the following actions

Scan the QR code to install the App and get 2 free unlocks

Unlock quizzes for free by uploading documents