Figure 9-29
The following diagram shows the domestic demand and domestic supply curves in a market.Assume that the world price in this market is $1 per unit. 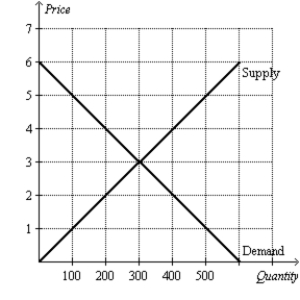
-Refer to Figure 9-29.With no trade allowed,what are the equilibrium price and equilibrium quantity in this market?
Correct Answer:
Verified
View Answer
Unlock this answer now
Get Access to more Verified Answers free of charge
Q25: Scenario 9-3
Suppose domestic demand and domestic supply
Q26: Scenario 9-3
Suppose domestic demand and domestic supply
Q27: Figure 9-29
The following diagram shows the domestic
Q28: Figure 9-28
The following diagram shows the domestic
Q29: Figure 9-29
The following diagram shows the domestic
Q31: Figure 9-27
The following diagram shows the domestic
Q32: Figure 9-28
The following diagram shows the domestic
Q33: Scenario 9-3
Suppose domestic demand and domestic supply
Q34: Scenario 9-3
Suppose domestic demand and domestic supply
Q35: Scenario 9-3
Suppose domestic demand and domestic supply
Unlock this Answer For Free Now!
View this answer and more for free by performing one of the following actions

Scan the QR code to install the App and get 2 free unlocks

Unlock quizzes for free by uploading documents