Figure 9-27
The following diagram shows the domestic demand and supply curves in a market.Assume that the world price in this market is $20 per unit. 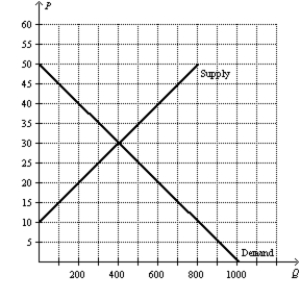
-Refer to Figure 9-27.If the country allows free trade,by how much do consumer surplus,producer surplus,and total surplus change with trade?
Correct Answer:
Verified
View Answer
Unlock this answer now
Get Access to more Verified Answers free of charge
Q19: Figure 9-27
The following diagram shows the domestic
Q21: Figure 9-28
The following diagram shows the domestic
Q22: Figure 9-28
The following diagram shows the domestic
Q23: Scenario 9-3
Suppose domestic demand and domestic supply
Q24: Figure 9-28
The following diagram shows the domestic
Q25: Scenario 9-3
Suppose domestic demand and domestic supply
Q62: Suppose in the country of Jumanji that
Q63: Suppose in the country of Nash that
Q67: A country has a comparative advantage in
Q69: Suppose the world price of coffee is
Unlock this Answer For Free Now!
View this answer and more for free by performing one of the following actions

Scan the QR code to install the App and get 2 free unlocks

Unlock quizzes for free by uploading documents