Figure 9-26
The following diagram shows the domestic demand and domestic supply curves in a market. 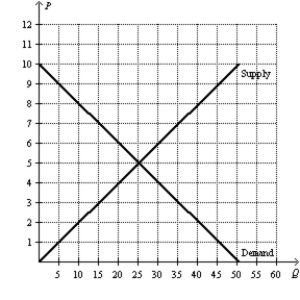
-Refer to Figure 9-26.With no trade allowed,what are the equilibrium price and equilibrium quantity in this market?
Correct Answer:
Verified
View Answer
Unlock this answer now
Get Access to more Verified Answers free of charge
Q5: Figure 9-26
The following diagram shows the domestic
Q6: Figure 9-27
The following diagram shows the domestic
Q8: Figure 9-26
The following diagram shows the domestic
Q9: Figure 9-27
The following diagram shows the domestic
Q13: Figure 9-27
The following diagram shows the domestic
Q14: Figure 9-26
The following diagram shows the domestic
Q63: Suppose in the country of Nash that
Q66: Suppose in the country of Nash that
Q72: Suppose in the country of Jumanji that
Q80: A tax on an imported good is
Unlock this Answer For Free Now!
View this answer and more for free by performing one of the following actions

Scan the QR code to install the App and get 2 free unlocks

Unlock quizzes for free by uploading documents