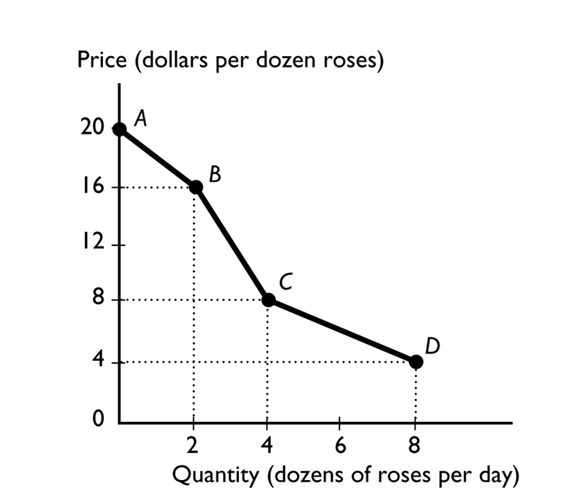
The figure above shows the relationship between the price of a dozen roses and the quantity of roses a florist can sell. The slope between points B and C equals
A) 4.
B) 8.
C) 14.
D) 16.
E) 2.
Correct Answer:
Verified
Q18: Economics is best defined as the social
Q19: Demonstrating how an economic variable changes from
Q20: Mothers Against Drunk Drivers (MADD)campaigned to increase
Q21: Which of the following is a macroeconomic
Q22: If the change in y = 10
Q24: Making choices on the margin means
A)scribbling on
Q25: Choices that are best for the society
Q26: The marginal cost of an activity --------------------as
Q27: A time series graph
A)is not useful if
Q28: ![]()
Unlock this Answer For Free Now!
View this answer and more for free by performing one of the following actions

Scan the QR code to install the App and get 2 free unlocks

Unlock quizzes for free by uploading documents