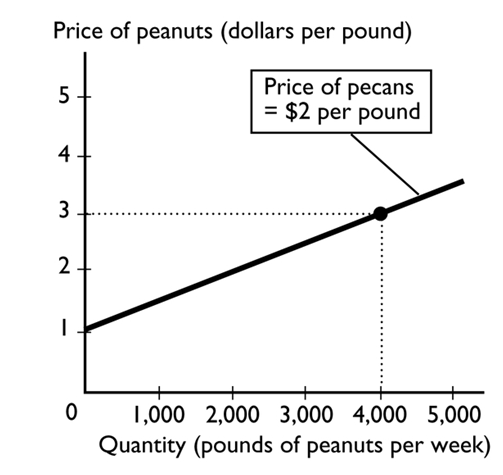
In the above figure, while drawing the line showing the relationship between the price of a pound of peanuts and the quantity sold, the
A) price of a pound of pecans does not change.
B) the quantity of peanuts that farmers supply does not change.
C) price of a pound of peanuts does not change.
D) Both answers A and B are correct.
E) Both answers B and C are correct.
Correct Answer:
Verified
Q34: Which of the following is true regarding
Q35: A time-series graph measures
A)time on the x-axis
Q36: If a curve rises and then falls,
Q37: When analyzing graphically the relationship between more
Q38: Normative statements
I. describe how the world is.
Ii.
Q40: In order to make a rational choice,
Q41: Suppose you decide to attend summer school
Q42: A positive statement
A)might be right or wrong.
B)cannot
Q43: An independent relationship between two variables is
Q44: A rational choice is one that
A)always turns
Unlock this Answer For Free Now!
View this answer and more for free by performing one of the following actions

Scan the QR code to install the App and get 2 free unlocks

Unlock quizzes for free by uploading documents