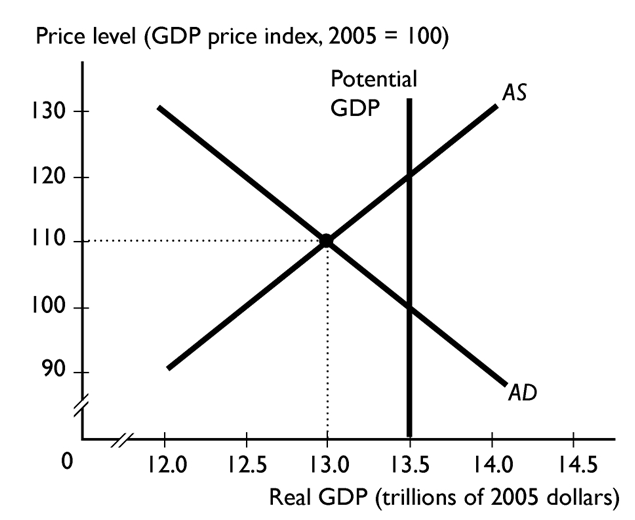
In the figure above, the economy is at an equilibrium with real GDP of $13 trillion and a price level of 110. As the economy moves toward its ultimate equilibrium, the -------------------- curve shifts-------------------- .
A) aggregate supply; leftward
B) potential GDP; leftward
C) aggregate demand; rightward
D) aggregate supply; rightward
E) aggregate demand; leftward
Correct Answer:
Verified
Q115: During a demand-pull inflation, if the Fed
Q116: If there is an increase in expected
Q117: When the price level increases there is--------------------
Q118: In a demand-pull inflation, if the Fed
Q119: A fall in the price level brings
Q121: The --------------------the -------------------- is the quantity
Q122: An increase in the price level --------------------the
Unlock this Answer For Free Now!
View this answer and more for free by performing one of the following actions

Scan the QR code to install the App and get 2 free unlocks

Unlock quizzes for free by uploading documents