Figure 10-20. 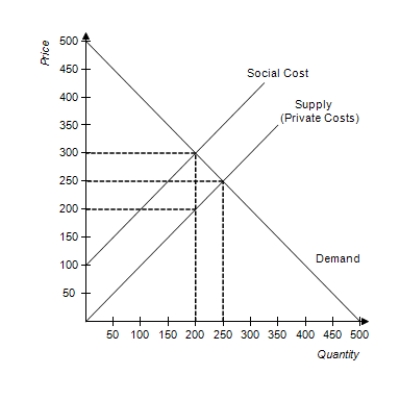
-Refer to Figure 10-20. The graph depicts the market for fertilizer. What is the socially optimal quantity of fertilizer?
A) 100 units
B) 200 units
C) 250 units
D) 300 units
Correct Answer:
Verified
Q441: Figure 10-20. Q442: Market failure can be caused by Q443: In the absence of externalities, the "invisible Q444: In a market economy, government intervention Q445: A rain barrel is a container that Q447: The term market failure refers to Q448: An externality is the impact of Q449: Scenario 10-1 Q450: Scenario 10-1 Q451: Scenario 10-1![]()
A)too much
A)will always
A)a market
A)society's decisions
The demand curve for gasoline slopes
The demand curve for gasoline slopes
The demand curve for gasoline slopes
Unlock this Answer For Free Now!
View this answer and more for free by performing one of the following actions

Scan the QR code to install the App and get 2 free unlocks

Unlock quizzes for free by uploading documents