Figure 10-20. 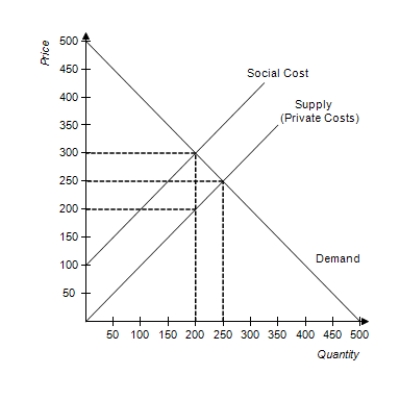
-Refer to Figure 10-20. The graph depicts the market for fertilizer. What is the socially optimal price of fertilizer?
A) $100
B) $200
C) $250
D) $300
Correct Answer:
Verified
Q451: Scenario 10-1
The demand curve for gasoline slopes
Q452: Suppose the market-equilibrium quantity of good x
Q453: Figure 10-20. Q454: Education is heavily subsidized through public schools Q455: Education yields positive externalities. For example, a Q457: Education yields positive externalities. For example, Q458: An externality is an example of Q459: Suppose the socially-optimal quantity of good x Q460: Figure 10-20. Q461: When externalities exist, buyers and sellers![]()
A)colleges and
A)a corrective![]()
A)neglect the
Unlock this Answer For Free Now!
View this answer and more for free by performing one of the following actions

Scan the QR code to install the App and get 2 free unlocks

Unlock quizzes for free by uploading documents