Figure 10-15 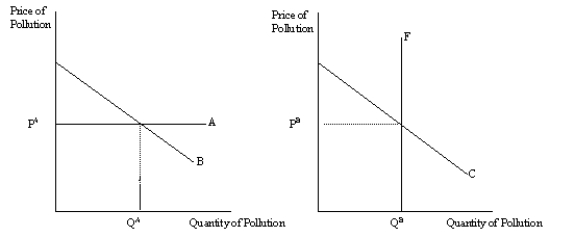
-Refer to Figure 10-15. Which graph illustrates a corrective tax?
A) the left graph
B) the right graph
C) both graphs
D) neither graph
Correct Answer:
Verified
Q165: Suppose that alcohol consumption creates a negative
Q166: Which of the following statements is correct?
A)Corrective
Q167: Suppose that flu shots create a positive
Q169: Suppose that electricity producers create a negative
Q170: Suppose that flu shots create a positive
Q171: Suppose planting flowering shrubs creates a positive
Q172: Suppose that electricity producers create a negative
Q173: Suppose that flu shots create a positive
Q182: Suppose that candy producers create a positive
Q199: Suppose that electricity producers create a negative
Unlock this Answer For Free Now!
View this answer and more for free by performing one of the following actions

Scan the QR code to install the App and get 2 free unlocks

Unlock quizzes for free by uploading documents