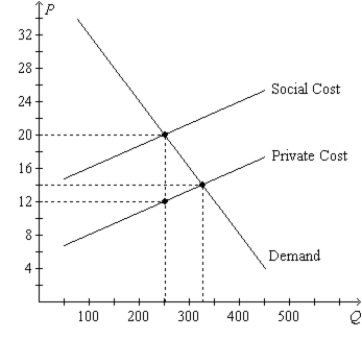
Figure 10-13. On the graph, Q represents the quantity of plastics and P represents the price of plastics. 
-Refer to Figure 10-13. If 325 units of plastics are produced and consumed, then the
A) social optimum has been reached.
B) market equilibrium has been reached.
C) government must have imposed a corrective tax to guide the market to this outcome.
D) government must have offered a corrective subsidy to guide the market to this outcome.
Correct Answer:
Verified
Q133: When the government uses a command-and-control policy
Q134: Figure 10-13. On the graph, Q represents
Q135: Suppose that an MBA degree creates no
Q136: In Singapore, littering fines are strictly enforced.
Q137: By allowing an income-tax deduction for charitable
Q139: A corrective tax is also known as:
A)a
Q140: The Coase theorem asserts that the private
Q141: Emission controls on automobiles are an example
Q183: If the government were to limit the
Q184: Which of the following is not an
Unlock this Answer For Free Now!
View this answer and more for free by performing one of the following actions

Scan the QR code to install the App and get 2 free unlocks

Unlock quizzes for free by uploading documents