Using the graph shown, construct a demand curve for M&M's given an income of $10. 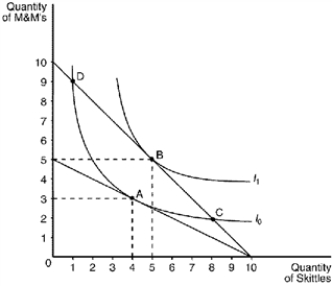
Correct Answer:
Verified
Q86: Is it possible for a normal good
Q99: For Meg, the substitution effect of an
Q106: Assume that a person consumes two goods,
Q108: Explain the relationship between the budget constraint
Q117: Graphically demonstrate the conditions associated with a
Q556: Figure 21-32 The figure shows three indifference
Q557: Figure 21-32 The figure shows three indifference
Q560: Figure 21-32 The figure shows three indifference
Q565: Janet knows that she will ultimately face
Q566: Draw indifference curves that reflect the following
Unlock this Answer For Free Now!
View this answer and more for free by performing one of the following actions

Scan the QR code to install the App and get 2 free unlocks

Unlock quizzes for free by uploading documents