Figure 21-30 The graph shows two budget constraints for a consumer. 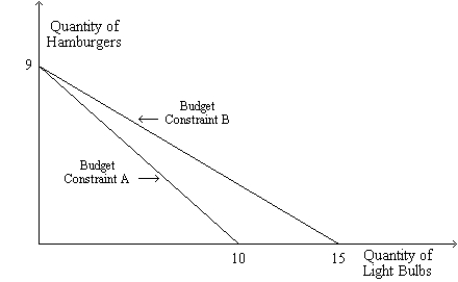
-Refer to Figure 21-30. Suppose the price of a hamburger is $10 and Budget Constraint A applies. What is the consumer's income? What is the price of a light bulb?
Correct Answer:
Verified
View Answer
Unlock this answer now
Get Access to more Verified Answers free of charge
Q61: What does the slope of a consumer's
Q63: A consumer's budget constraint is drawn on
Q65: A consumer's budget constraint is drawn with
Q71: What is significant about a point on
Q75: The rate at which a consumer is
Q79: If goods X and Y are both
Q514: Scenario 21-4 Frank spends all of his
Q515: Which of the following statements is not
Q517: Scenario 21-4 Frank spends all of his
Q519: The theory of consumer choice examines how
A)firms
Unlock this Answer For Free Now!
View this answer and more for free by performing one of the following actions

Scan the QR code to install the App and get 2 free unlocks

Unlock quizzes for free by uploading documents