Figure 21-3
In each case, the budget constraint moves from BC-1 to BC-2. 
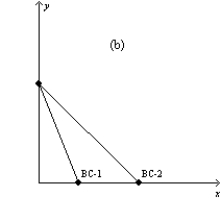
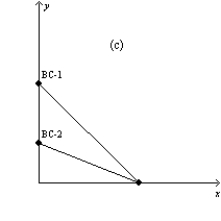
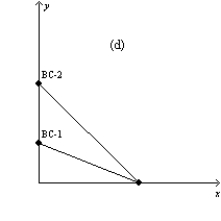
-Refer to Figure 21-3. Which of the graphs in the figure could reflect a simultaneous decrease in the price of good X and increase in the price of good Y? (i)
Graph a
(ii)
Graph b
(iii)
Graph c
(iv)
Graph d
A) (ii) only
B) (iii) only
C) (ii) or (iv) only
D) None of the above is correct.
Correct Answer:
Verified
Q171: If Priscilla regards cheese and crackers as
Q399: Figure 21-1 The downward-sloping line on the
Q401: Figure 21-3
In each case, the budget constraint
Q402: Figure 21-5 Q403: Figure 21-5 Q405: Figure 21-5 Q406: Figure 21-4 Q407: Figure 21-5 Q408: Figure 21-3 Q409: Figure 21-5 Unlock this Answer For Free Now! View this answer and more for free by performing one of the following actions Scan the QR code to install the App and get 2 free unlocks Unlock quizzes for free by uploading documents
(a)
(b) ![]()
(a)
(b) ![]()
(a)
(b) ![]()
In each case, the budget constraint
(a)
(b) ![]()
In each case, the budget constraint
(a)
(b) ![]()

