Figure 21-25 The figure pertains to a particular consumer. On the axes, X represents the quantity of good X and Y represents the quantity of good Y. 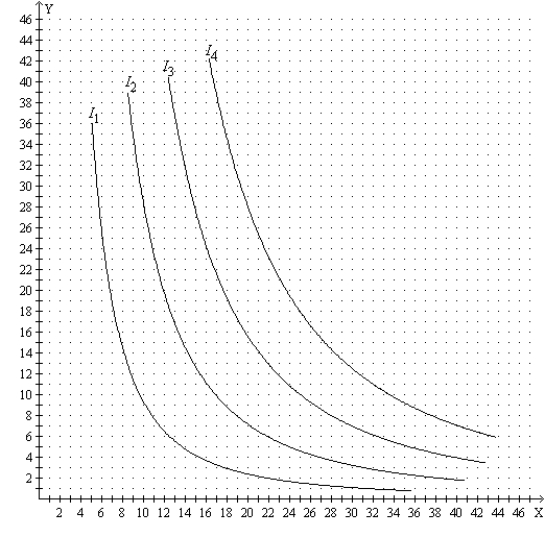
-Refer to Figure 21-25. Suppose the price of good X is $10, the price of good Y is $5, and the consumer's income is $210. Then the consumer's optimal choice is represented by a point on which curve?
A) I1
B) I2
C) I3
D) I4
Correct Answer:
Verified
Q200: A consumer consumes two normal goods, popcorn
Q257: Figure 21-23 Q258: You can think of an indifference curve Q259: Pepsi and pizza are normal goods. When Q260: The income effect of a price change Q262: Assume that goods X and Y are Q263: Figure 21-24 The figure shows three indifference Q264: Figure 21-24 The figure shows three indifference Q265: Figure 21-24 The figure shows three indifference Q266: Figure 21-25 The figure pertains to a![]()
Unlock this Answer For Free Now!
View this answer and more for free by performing one of the following actions

Scan the QR code to install the App and get 2 free unlocks

Unlock quizzes for free by uploading documents