Table 5-7
The following table shows a portion of the demand schedule for a particular good at various levels of income. 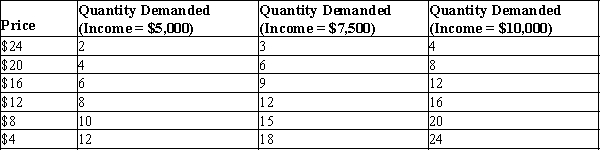
-Refer to Table 5-7. Using the midpoint method, at a price of $12, what is the income elasticity of demand when income rises from $5,000 to $10,000?
A) 0.00
B) 0.41
C) 1.00
D) 2.45
Correct Answer:
Verified
Q183: Assume that a 4 percent increase in
Q194: You and your college roommate eat three
Q247: Suppose the income elasticity of demand is
Q259: Danita rescues dogs from her local animal
Q266: Heath's income elasticity of demand for concerts
Q268: Assume that a 4 percent decrease in
Q270: While in college,John and Bethany each buy
Q280: While in college,Marty and Laura each buy
Q509: Table 5-8 Q515: Table 5-7![]()
The following table shows a portion
Unlock this Answer For Free Now!
View this answer and more for free by performing one of the following actions

Scan the QR code to install the App and get 2 free unlocks

Unlock quizzes for free by uploading documents