Table 5-7
The following table shows a portion of the demand schedule for a particular good at various levels of income. 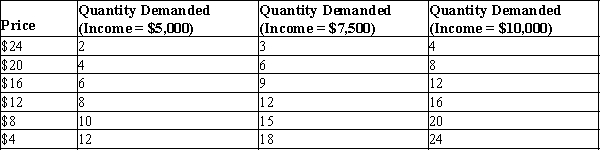
-Refer to Table 5-7. Using the midpoint method, at a price of $8, what is the income elasticity of demand when income rises from $7,500 to $10,000?
A) 0.00
B) 0.41
C) 1.00
D) 2.45
Correct Answer:
Verified
Q228: Figure 5-12 Q244: For which of the following types of Q250: Last year,Max bought 6 pairs of athletic Q251: Last year,Jim bought 8 tickets to sporting Q252: Last year,Tess bought 5 handbags when her Q257: Which of the following should be held Q258: Which of the following should be held Q278: You and your college roommate eat three Q279: When her income increased from $10,000 to Q501: Table 5-7![]()
The following table shows a portion
Unlock this Answer For Free Now!
View this answer and more for free by performing one of the following actions

Scan the QR code to install the App and get 2 free unlocks

Unlock quizzes for free by uploading documents