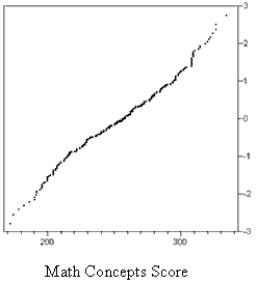
The graphs below are normal probability plots of the vocabulary and math concept scores on a standardized exam for a large sample of students. One of the score distributions is approximately normal. Identify the score distribution that is approximately normal and explain the reason for your choice. 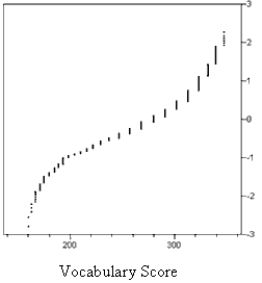
Correct Answer:
Verified
View Answer
Unlock this answer now
Get Access to more Verified Answers free of charge
Q16: What information about a probability distribution do
Q18: For a discrete random variable, 
Q19: A normal probability plot suggests that a
Q20: For random variables, x and y, if
Q21: Briefly describe how the correlation coefficient can
Q22: The owners of the Burger Emporium are
Q25: Briefly describe how one would decide which
Q26: The owners of the Burger Emporium are
Q27: When driving the nation's highways Anna is
Q28: In the somewhat less than towering ski
Unlock this Answer For Free Now!
View this answer and more for free by performing one of the following actions

Scan the QR code to install the App and get 2 free unlocks

Unlock quizzes for free by uploading documents