As part of the iguana risk assessment experiment described in the previous problem, investigators replicated the experiment with one difference--the investigators approached the iguanas at a tangent, passing by the iguana with a closest distance being 2 meters. Summary statistics for the approach distances for the two treatments, Eye Contact and No Eye Contact, are given in the table below: 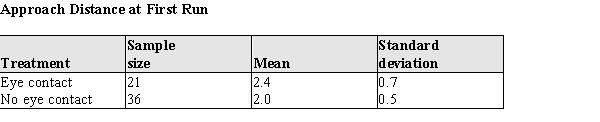 An initial analysis of the data revealed that it was reasonable to assume the population approach distances at first run were both approximately normal.
a) Construct a 95% confidence interval for the difference in approach distances for the eye contact and no eye contact treatments.
b) Do the data indicate that for a tangential approach, the population means differ? Justify your answer statistically.
Correct Answer:
Verified
View Answer
Unlock this answer now
Get Access to more Verified Answers free of charge
Q6: Comparison of means focuses on the difference
Q7: The standard deviation of p1 − p2
Q8: The P-value of an upper-tail t test
Q9: When comparing two population means, it is
Q10: The large sample z test for μ1
Unlock this Answer For Free Now!
View this answer and more for free by performing one of the following actions

Scan the QR code to install the App and get 2 free unlocks

Unlock quizzes for free by uploading documents