The scatter plot and residual plot shown below are from a regression analysis of Prehistoric Native American projectile points. The lengths of the projectiles were regressed on the width of the projectile points. 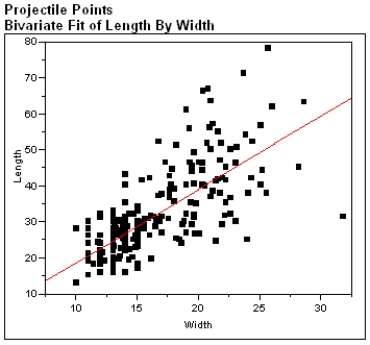
 Using these plots categorize each of the Basic Assumptions of the simple linear regression model as one of the following:
a) Not checkable
b) Checked and met
c) Checked and not met
For all assumptions checked, explain what aspect of the graphs led you to your conclusion that the assumption was met or not met.
Correct Answer:
Verified
• The distrib...
View Answer
Unlock this answer now
Get Access to more Verified Answers free of charge
Q16: In the simple linear regression model, the
Q17: The t-ratio for testing ρ = 0
Q18: There is more uncertainty in predicting a
Q19: A standardized residual plot with spread increasing
Q20: The point estimate a + bx* is
Q22: The computer output given below shows a
Q23: In a random sample of large cities
Q24: In a study of the surface temperatures
Q25: The Iowa Tests of Educational Development are
Q26: In a study of gender-typing of toys,
Unlock this Answer For Free Now!
View this answer and more for free by performing one of the following actions

Scan the QR code to install the App and get 2 free unlocks

Unlock quizzes for free by uploading documents