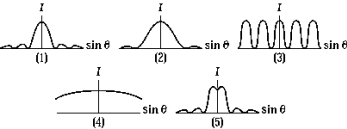
 The graphs are plots of relative intensities of various diffraction patterns versus the sine of the angle from the central maximum. The graph that represents the diffraction pattern from the widest single slit is
A) 1) .
B) 2) .
C) 3) .
D) 4) .
E) 5) .
Correct Answer:
Verified
Q8: Diffraction of sound waves is more readily
Q34: In an experiment to demonstrate interference of
Q48: Light of wavelength 650 nm is incident
Q59: In dealing with the diffraction pattern of
Q156: If a thin soap film n =
Q157: When the slits in Young's experiment are
Q158: Light of wavelength 500 nm illuminates parallel
Unlock this Answer For Free Now!
View this answer and more for free by performing one of the following actions

Scan the QR code to install the App and get 2 free unlocks

Unlock quizzes for free by uploading documents