Multiple Choice
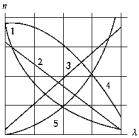 In the laboratory you used the spectrometer to determine the indices of refraction of various wavelengths of light. The curve that could represent a plot of the index of refraction as a function of the wavelength of the light is
A) 1.
B) 2.
C) 3.
D) 4.
E) 5.
Correct Answer:
Verified
Related Questions
Q3: From directly above,you're watching a fish swim
Q9: Q10: Light is incident on a piece of Q10: Light traveling in a transparent medium with Q12: You are trying to catch fish by Unlock this Answer For Free Now! View this answer and more for free by performing one of the following actions Scan the QR code to install the App and get 2 free unlocks Unlock quizzes for free by uploading documents![]()

