The figure given below shows the production-possibility curves of Canada (AB) and the Rest of the World (CD) . The pre-trade price ratio in Canada and the Rest of the World are given by the lines P1 and P3 respectively. The international price ratio faced by the countries is represented by the line P2. I?1 and I2 are the pre-trade and post-trade social indifference curves for both Canada and the Rest of the World respectively. In the absence of trade, Canada consumes _____ bales of cotton and _____ bushels of wheat. 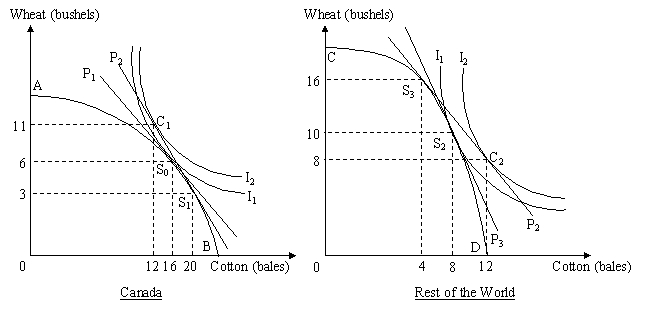
A) 20; 3
B) 16; 6
C) 20; 6
D) 12; 11
Correct Answer:
Verified
Q12: In the figure given below AB is
Q13: Which of the following statements is true
Q14: The figure given below shows the production-possibility
Q15: Which of the following best explains why
Q16: Assume that country X produces two goods-sugar
Q18: Assume a two-country, two-good, and two inputs
Q19: Assume a two-country two-good two-input model where
Q20: Assume a two-country, two-good, and two-input model.
Q21: In the absence of trade, a country
Q22: According to the Heckscher-Ohlin theory, if the
Unlock this Answer For Free Now!
View this answer and more for free by performing one of the following actions

Scan the QR code to install the App and get 2 free unlocks

Unlock quizzes for free by uploading documents