The figure given below shows the market for shoes in the U.S. The domestic price line with tariff lies above the international price line. Dd and Sd are the domestic demand and supply curves of shoes respectively. 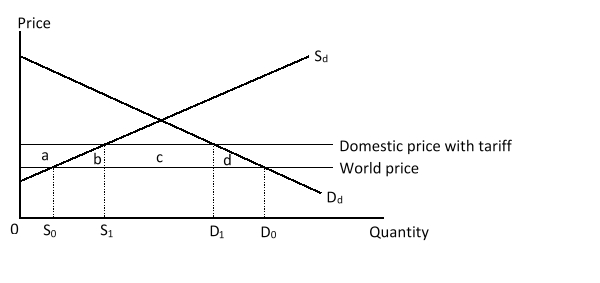 The tariff revenue of the U.S. government is shown by area _____.
A) a
B) (a + b)
C) c
D) (b + c + d)
Correct Answer:
Verified
Q12: The figure given below shows the market
Q13: A(n)_ is a tax on imports that
Q14: The figure given below shows the market
Q15: If a small country imposes a tariff
Q16: Which of the following is an impact
Q18: The figure given below shows the market
Q19: The figure given below shows the market
Q20: Which of the following refers to the
Q21: Suppose country A collectively enjoys monopsony power
Q22: Which of the following statements is NOT
Unlock this Answer For Free Now!
View this answer and more for free by performing one of the following actions

Scan the QR code to install the App and get 2 free unlocks

Unlock quizzes for free by uploading documents