The frequency distribution below was constructed from data collected on the quarts of soft drinks consumed per week by 20 students. 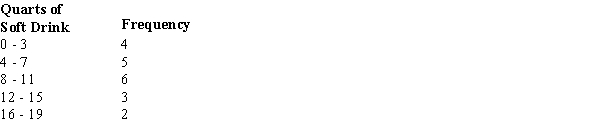
a.
Construct a relative frequency distribution.
b.
Construct a cumulative frequency distribution.
c.
Construct a cumulative relative frequency distribution.
Correct Answer:
Verified
Q1: A histogram is
A) a graphical presentation of
Q4: Fifteen percent of the students in a
Q5: In a scatter diagram, a line that
Q6: The sum of the percent frequencies for
Q21: The numbers of hours worked (per week)
Q23: There are 800 students in the School
Q24: The following data set shows the number
Q26: You are given the following data on
Q27: The grades of 10 students in their
Q28: Which of the following graphical methods shows
Unlock this Answer For Free Now!
View this answer and more for free by performing one of the following actions

Scan the QR code to install the App and get 2 free unlocks

Unlock quizzes for free by uploading documents