SCENARIO 19-3
A quality control analyst for a light bulb manufacturer is concerned that the time it takes to produce a batch of light bulbs is too erratic.Accordingly,the analyst randomly surveys 10 production periods each day for 14 days and records the sample mean and range for each day.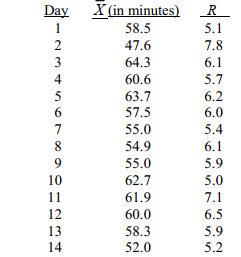
-Referring to Scenario 19-3,suppose the analyst constructs an R chart to see if the variability in production times is in-control.The R chart is characterized by which of the following?
A) Increasing trend
B) Decreasing trend
C) In-control
D) Points outside the control limits
Correct Answer:
Verified
Q34: SCENARIO 19-4
A factory supervisor is concerned that
Q35: SCENARIO 19-3
A quality control analyst for a
Q36: SCENARIO 19-4
A factory supervisor is concerned that
Q37: The control limits are based on the
Q38: SCENARIO 19-3
A quality control analyst for a
Q40: SCENARIO 19-4
A factory supervisor is concerned that
Q41: Common causes of variation represent variation due
Q42: In the United States,the control limits on
Q43: The cause of variation that can be
Q44: Common causes of variation are correctable without
Unlock this Answer For Free Now!
View this answer and more for free by performing one of the following actions

Scan the QR code to install the App and get 2 free unlocks

Unlock quizzes for free by uploading documents