SCENARIO 19-3
A quality control analyst for a light bulb manufacturer is concerned that the time it takes to produce a batch of light bulbs is too erratic.Accordingly,the analyst randomly surveys 10 production periods each day for 14 days and records the sample mean and range for each day.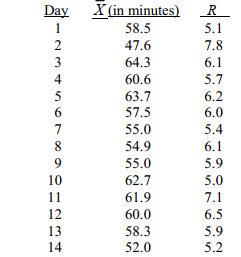
-Referring to Scenario 19-3,suppose the analyst constructs an R chart to see if the variability in production times is in-control.What is the lower control limit for this R chart?
A) 4.84
B) 3.37
C) 2.98
D) 1.34
Correct Answer:
Verified
Q5: SCENARIO 19-2
A political pollster randomly selects a
Q6: The control chart
A)focuses on the time dimension
Q7: SCENARIO 19-2
A political pollster randomly selects a
Q8: SCENARIO 19-1
A local newspaper has 10 delivery
Q9: SCENARIO 19-1
A local newspaper has 10 delivery
Q11: SCENARIO 19-1
A local newspaper has 10 delivery
Q12: Which of the following situations suggests a
Q13: Variation due to the inherent variability in
Q14: Once the control limits are set for
Q15: SCENARIO 19-2
A political pollster randomly selects a
Unlock this Answer For Free Now!
View this answer and more for free by performing one of the following actions

Scan the QR code to install the App and get 2 free unlocks

Unlock quizzes for free by uploading documents