SCENARIO 17-3
The tree diagram below shows the results of the classification tree model that has been constructed to predict the probability of a cable company's customers who will switch ("Yes" or "No")into its bundled program offering based on the price ($30,$40,$50,$60)and whether the customer spends more than 5 hours a day watching TV ("Yes" or "No")using the data set of 100 customers collected from a survey.

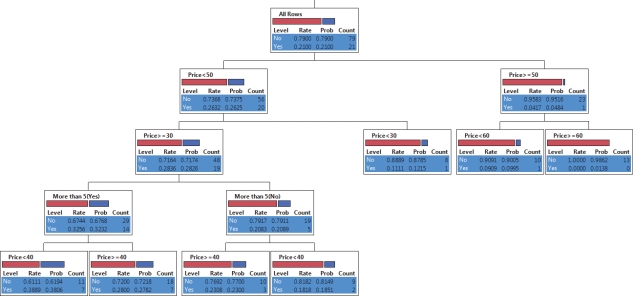
-Referring to Scenario 17-3,the highest probability of switching is predicted to occur among customers who watch more than 5 hours of TV a day and are offered the bundled price of between $30 and $40.
Correct Answer:
Verified
Q64: SCENARIO 17-4
The regression tree below was obtained
Q65: SCENARIO 17-4
The regression tree below was obtained
Q66: SCENARIO 17-4
The regression tree below was obtained
Q67: Neural networks do not make any a
Q68: SCENARIO 17-4
The regression tree below was obtained
Q70: SCENARIO 17-3
The tree diagram below shows the
Q71: SCENARIO 17-4
The regression tree below was obtained
Q72: SCENARIO 17-3
The tree diagram below shows the
Q73: SCENARIO 17-4
The regression tree below was obtained
Q74: The forward-and-backward computation among the three layers
Unlock this Answer For Free Now!
View this answer and more for free by performing one of the following actions

Scan the QR code to install the App and get 2 free unlocks

Unlock quizzes for free by uploading documents