SCENARIO 17-1
The table below contains the sparklines for the rates of return (in percentage)for three different stocks from 2007 to 2013.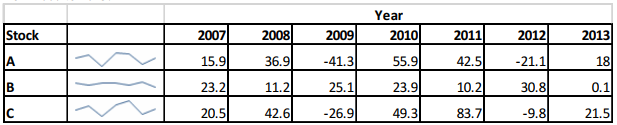
-Referring to Scenario 17-1,the sparklines enable you to draw conclusions on the historical trend of the rates of return of the three stocks.
Correct Answer:
Verified
Q18: You can compute any of the numerical
Q19: Most information design specialists prefer bullet graphs
Q20: Double-clicking a cell in a PivotTable causes
Q21: Which of the following is NOT one
Q22: Which of the following is NOT among
Q24: Data mining uses various techniques to extract
Q25: SCENARIO 17-2
The treemap below shows the amounts
Q26: SCENARIO 17-2
The treemap below shows the amounts
Q27: SCENARIO 17-2
The treemap below shows the amounts
Q28: SCENARIO 17-1
The table below contains the sparklines
Unlock this Answer For Free Now!
View this answer and more for free by performing one of the following actions

Scan the QR code to install the App and get 2 free unlocks

Unlock quizzes for free by uploading documents