Which of the following graphs illustrates the behavior of a total variable cost? 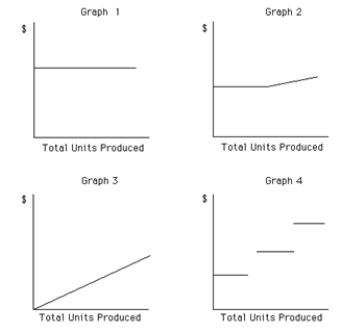
A) Graph 2
B) Graph 3
C) Graph 4
D) Graph 1
Correct Answer:
Verified
Q69: ABC Co.manufactures pens.During the most productive month
Q70: Which of the following is an example
Q71: _ per unit increases or decreases in
Q72: Using the high-low method, calculate variable
Q73: Which of the following activity bases would
Q75: The electricity expense in a production plant
Q76: The following information is given for
Q77: The systematic examination of the relationships among
Q78: For the purpose of analysis, mixed costs
Q79: Which of the following statements is true
Unlock this Answer For Free Now!
View this answer and more for free by performing one of the following actions

Scan the QR code to install the App and get 2 free unlocks

Unlock quizzes for free by uploading documents