Which of the following graphs illustrates the behavior of a total fixed cost within the specified relevant range? 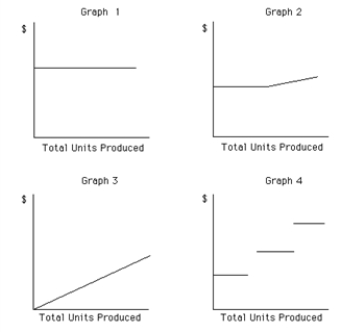
A) Graph 2
B) Graph 3
C) Graph 4
D) Graph 1
Correct Answer:
Verified
Q39: A change in fixed costs as a
Q40: The ratio that indicates the percentage of
Q41: Which of the following activity bases would
Q42: Only a single line, which represents the
Q44: Even if a business sells six products,
Q45: DeGiaimo Co.has an operating leverage of 5.If
Q46: Costs that remain constant on a per-unit
Q47: If the volume of sales is $4,000,000
Q49: If a business sells four products, it
Q49: Cost-volume-profit analysis can be presented in both
Unlock this Answer For Free Now!
View this answer and more for free by performing one of the following actions

Scan the QR code to install the App and get 2 free unlocks

Unlock quizzes for free by uploading documents