The diagram below shows a set of budget lines facing a household. 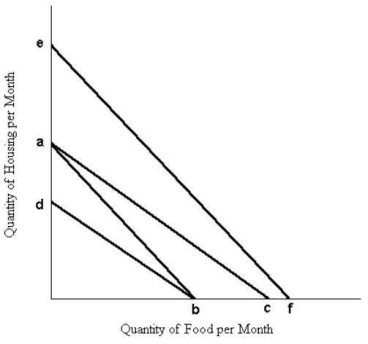 FIGURE 6-7
-Refer to Figure 6-6.
A) under the demand curve to the left of Q0, but above P0.
B) under the demand curve to the left of Q0.
C) under the entire demand curve.
D) above the market price.
E) below P0 and to the left of Q0.
Correct Answer:
Verified
Q63: A parallel shift in the consumer's budget
Q65: The diagram below shows a set of
Q66: Suppose Arun consumes only 2 goods --
Q68: Assume a person reveals the following demand
Q81: An equal proportional increase in money income
Q88: The demand curve for a good with
Q93: The "law" of diminishing marginal utility implies
Q95: Consider the pizza market, with a downward-
Q107: The table below shows the total
Q111: The substitution effect is the change in
Unlock this Answer For Free Now!
View this answer and more for free by performing one of the following actions

Scan the QR code to install the App and get 2 free unlocks

Unlock quizzes for free by uploading documents