The diagram below shows some short- run cost curves for a firm. 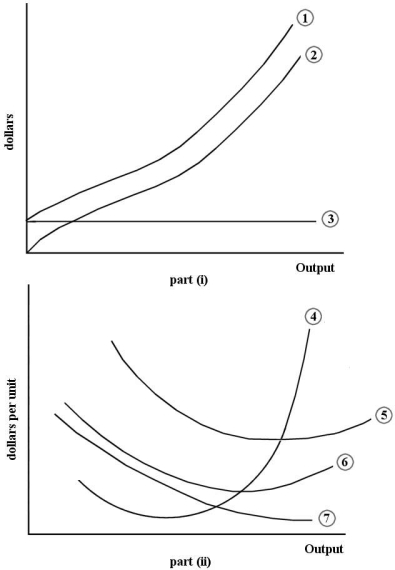 FIGURE 7- 2
  4
4
-Refer to Figure 7- 2. Which of the following choices correctly identifies the cost curves in part (i) of the figure?
A) Curve 1 is the total cost curve. Curve 2 is the total variable cost curve. Curve 3 is the average fixed cost curve.
B) Curve 1 is the total cost curve. Curve 2 is the total variable cost curve. Curve 3 is the total fixed cost curve.
C) Curve 1 is the total marginal cost curve. Curve 2 is the total average cost curve. Curve 3 is the total average fixed cost curve.
D) Curve 1 is the total fixed cost curve. Curve 2 is the total variable cost curve. Curve 3 is the total cost curve.
E) Curve 1 is the total variable cost curve. Curve 2 is the total cost curve. Curve 3 is the total fixed cost curve.
Correct Answer:
Verified
Q10: Which one of the following types of
Q12: The opportunity cost of money that a
Q13: Marginal cost is defined as the
A) cost
Q15: When a firm's marginal cost is rising,
Q16: The table below provides the total
Q17: The opportunity cost of any factor of
Q18: Suppose that when one additional unit of
Q19: A firm's short- run marginal cost curve
Q65: The following data show the total output
Q99: The following data show the total output
Unlock this Answer For Free Now!
View this answer and more for free by performing one of the following actions

Scan the QR code to install the App and get 2 free unlocks

Unlock quizzes for free by uploading documents