The figure below shows a family of cost curves for a firm. The subscripts 1, 2, and 3 for the SRATC curves refer to different plant sizes. 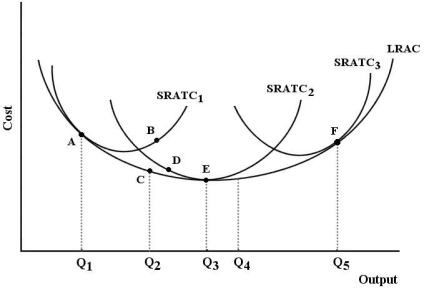 FIGURE 8-3
-Refer to Figure 8-3. The minimum efficient scale is achieved by this firm at output level
A) Q₃.
B) Q₄.
C) Q₂.
D) Q₁.
E) Q5.
Correct Answer:
Verified
Q41: Suppose that capital costs $6 per unit
Q42: Movement from one point to another along
Q43: The figure below shows the isocost lines
Q43: When there is no other way of
Q44: A firm operates at its least- cost
Q45: Which of the following paired concepts are
Q48: When a cost- minimizing firm is faced
Q53: The long- run average cost (LRAC) curve
Q58: The fact that new methods to extract
Q68: The figure below shows a family of
Unlock this Answer For Free Now!
View this answer and more for free by performing one of the following actions

Scan the QR code to install the App and get 2 free unlocks

Unlock quizzes for free by uploading documents