The following table shows the marginal products of capital (K) and labour (L) for various methods for Firm ABC to produce 1000 toys per day. 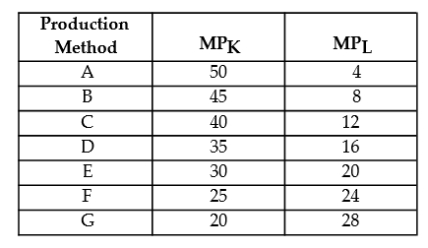 TABLE 8-2
-Refer to Figure 8-2. Increasing returns to scale occur over the output range
A) Q₂ to Q₃ only.
B) beyond Q₃ only.
C) 0 to Q₁ only.
D) Q₁ to Q₂ only.
E) 0 to Q₃ only.
Correct Answer:
Verified
Q13: TABLE 8-1 Q23: A short- run average total cost curve Q27: A short- run average total cost curve Q28: The creation of a new product is Q29: Suppose that a firm is using 100 Q31: A firm's long- run average cost curve Q38: Suppose a firm experiences decreasing returns to Q45: Which of the following paired concepts are Q47: If there is a fall in all Q59: A profit- maximizing firm with variable labour
![]()
A)
Unlock this Answer For Free Now!
View this answer and more for free by performing one of the following actions

Scan the QR code to install the App and get 2 free unlocks

Unlock quizzes for free by uploading documents