Use a graphing utility to graph the function and visually determine the intervals over which the function is increasing, decreasing, or constant. 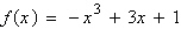
A) 
B) 
C) 
D) 
E) 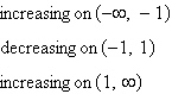
Correct Answer:
Verified
Q18: A rectangle is bounded by the x-axis
Q19: Use the graph of the function to
Q20: Use the Vertical Line Test to determine
Q21: Determine the intervals over which the function
Q22: Write an equation for the function that
Q24: Which function does the graph represent?
Q25: Which graph represents the function? g(x) =
Q26: Use the position equation Q27: Use a graphing utility to graph the Q28: Graph the function and determine the interval(s)![]()
Unlock this Answer For Free Now!
View this answer and more for free by performing one of the following actions

Scan the QR code to install the App and get 2 free unlocks

Unlock quizzes for free by uploading documents