Use a graphing utility to graph the inequalities. Shade the region representing the solution set of the system. 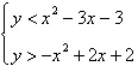
A) 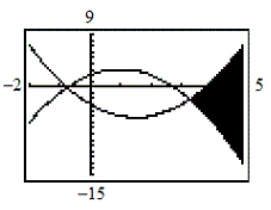
B) 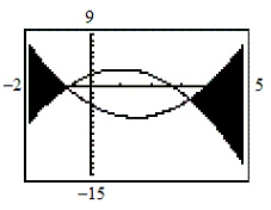
C) 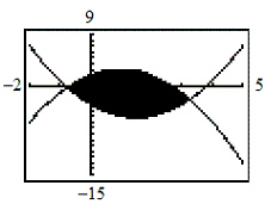
D) 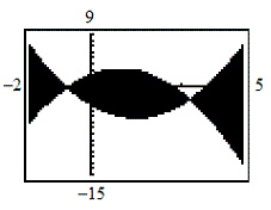
E) 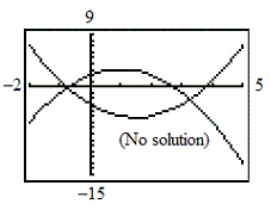
Correct Answer:
Verified
Q39: Solve the system of linear equations.
Q40: Find the equation of the parabola
Q41: Sketch the graph of the inequality.
Q42: Use a graphing utility to graph the
Q43: Write an inequality for the shaded region
Q45: Determine which one of the ordered pairs
Q46: Find the minimum and maximum values of
Q47: Find the minimum and maximum values of
Q48: Derive a set of inequalities to describe
Q49: For the given supply and demand equations,
Unlock this Answer For Free Now!
View this answer and more for free by performing one of the following actions

Scan the QR code to install the App and get 2 free unlocks

Unlock quizzes for free by uploading documents