Use the following to answer question:
Figure 2.3 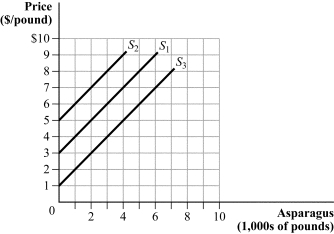
-(Figure 2.3) What could cause the supply curve to shift from S1 to S2?
A) an increase in the number of asparagus farmers
B) poor weather conditions that reduce the asparagus harvest
C) better fertilizers that lower the costs of production
D) a decrease in the price of asparagus
Correct Answer:
Verified
Q38: Use the following to answer questions 24-26:
Figure
Q39: Use the following to answer questions 24-26:
Figure
Q42: Use the following to answer question:
Figure 2.10
Q56: In market A, a 4% increase in
Q87: Suppose that the supply of oil to
Q92: In the blackberry market, the quantity demanded
Q100: The demand curve for a product is
Q101: The inverse demand curve for eggs is
Q102: Suppose that the demand and supply curves
Q105: Suppose that we observe a decrease in
Unlock this Answer For Free Now!
View this answer and more for free by performing one of the following actions

Scan the QR code to install the App and get 2 free unlocks

Unlock quizzes for free by uploading documents