Use the following to answer questions 11-12:
Figure 2.1 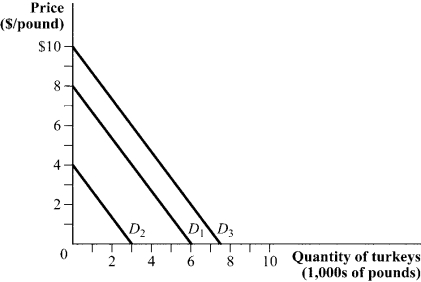
-(Figure 2.1) Mathematically, the demand curve D1 is described by this equation:
A) Q = 0.75 - P.
B) Q = 6 - 0.75P.
C) Q = 8 - 1.33P.
D) P = 6 - 8P.
Correct Answer:
Verified
Q12: Use the following to answer question:
Figure 2.3
Q15: Which of the following factors influences demand?
Q16: Which of the following is a key
Q20: Use the following to answer question:
Figure 2.2
Q22: Use the following to answer question:
Figure 2.5
Q41: Which of the following will not cause
Q62: Which of the following is not an
Q64: In the market for oranges, we observe
Q65: If the supply curve is QS =
Q117: If the demand curve is QD =
Unlock this Answer For Free Now!
View this answer and more for free by performing one of the following actions

Scan the QR code to install the App and get 2 free unlocks

Unlock quizzes for free by uploading documents