Exhibit 5-1 Demand curve
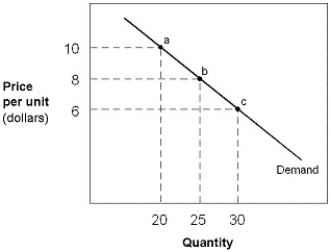
-In Exhibit 5-1, between points a and b, the price elasticity of demand measures:
A) 0.67.
B) 1.5.
C) 2.0.
D) 1.56.
E) 1.0.
Correct Answer:
Verified
Q10: Using the midpoints formula, what would be
Q19: If the percentage change in the quantity
Q27: If a decrease in the price of
Q28: The price elasticity of demand for a
Q30: Along the elastic range of a demand
Q31: Suppose Good Food's supermarket raises the price
Q32: If the demand curve is unit elastic,
Q33: If the demand curve over a certain
Q34: Exhibit 5-1 Demand curve Q176: If demand price elasticity measures 2, this
![]()
Unlock this Answer For Free Now!
View this answer and more for free by performing one of the following actions

Scan the QR code to install the App and get 2 free unlocks

Unlock quizzes for free by uploading documents