Figure: Demand-Driven Price Change 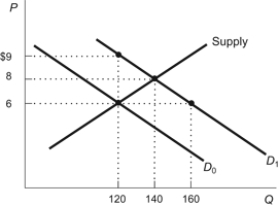 Refer to the figure. When the demand curve shifts from D0 to D1, the equilibrium price rises to:
A) $9 and the equilibrium quantity rises to 120.
B) $9 and the equilibrium quantity rises to 160.
C) $8 and the equilibrium quantity rises to 140.
D) $8 and the equilibrium quantity rises to 160.
Correct Answer:
Verified
Q107: Which of the following might explain why
Q112: If hipsters decide that Pabst Blue Ribbon
Q115: If the government institutes a tax on
Q119: For most of human history, salt was
Q129: How did the spread of the Internet
Q130: If the demand increases, what happens with
Q133: Figure: Supply-Driven Price Change Q137: If supply decreases and its slope remains Q139: How did the spread of the Internet Q140: An increase in demand causes a:![]()
A) temporary
Unlock this Answer For Free Now!
View this answer and more for free by performing one of the following actions

Scan the QR code to install the App and get 2 free unlocks

Unlock quizzes for free by uploading documents