Figure: Supply Elasticity 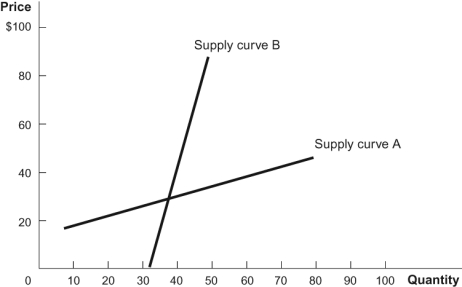 Refer to the figure. It shows two different supply curves. Based on the graph, which statement is TRUE?
A) The same price increase would cause a bigger increase in the quantity supplied along curve A.
B) The same price increase would cause a bigger increase in the quantity supplied along curve B.
C) Curve A reflects a less responsive supply.
D) If comparing responsiveness from a common point, like the intersection, we can conclude that supply curve B is more elastic.
Correct Answer:
Verified
Q123: If the price of cocoa rises by
Q127: If the price elasticity of supply is
Q141: The elasticity of supply measures:
A) the percent
Q143: Because of aging requirements it takes many
Q143: Table: Supply Curve
Q150: Which of the following mostly likely has
Q152: The elasticity of supply measures:
A) how quickly
Q153: If the price of coffee falls by
Q154: For a price increase from $100 to
Q160: The supply of a good tends to
Unlock this Answer For Free Now!
View this answer and more for free by performing one of the following actions

Scan the QR code to install the App and get 2 free unlocks

Unlock quizzes for free by uploading documents