Figure: Demand 2 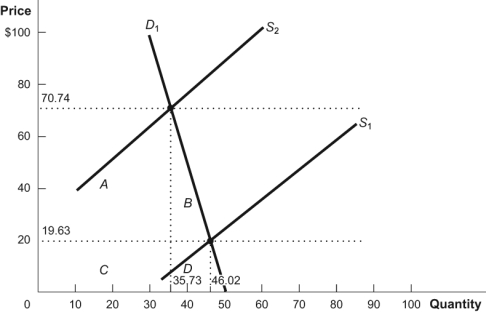 In the figure where S1 is the supply of drugs with no prohibition and S2 is the supply of drugs with prohibition, the area that represents total revenue with drug prohibition is ______, and the area that represents total revenue with no prohibition is ______.
A) A + C + D; B + D
B) C + D; A + C
C) A + C; C + D
D) B + D; A + C
Correct Answer:
Verified
Q104: Since roughly 1950, total revenues in the
Q107: Since the demand curve for computer chips
Q108: Which of the following statements is FALSE?
A)
Q109: A new per unit subsidy for almond
Q111: If the supply of a product is
Q113: In regards to the criminalization of drugs,
Q116: Which statement about the computer chip market
Q117: Why is the war on drugs hard
Q118: Compared to the 1980s, the price of
Q119: In the inelastic portion of a linear
Unlock this Answer For Free Now!
View this answer and more for free by performing one of the following actions

Scan the QR code to install the App and get 2 free unlocks

Unlock quizzes for free by uploading documents