Use the following to answer questions: Figure: Oil Market Diagrams 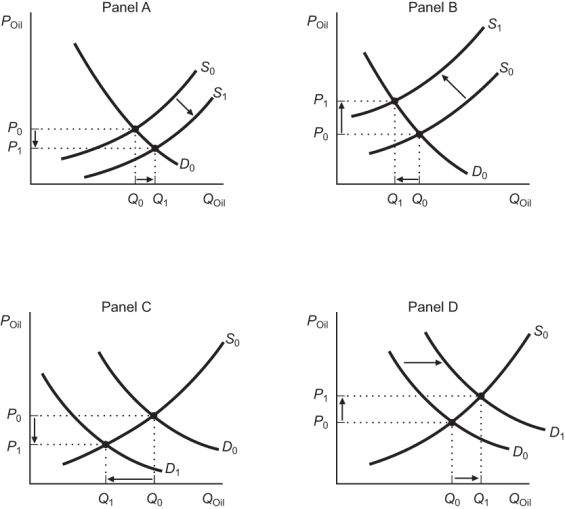
-(Figure: Oil Market Diagrams) Consider the world oil market diagrams presented in the figure. Which of the panels correctly depicts what happened in the market for oil during the 1973 OPEC oil crisis?
A) Panel A
B) Panel B
C) Panel C
D) Panel D
Correct Answer:
Verified
Q133: The five most recent U.S. recessions:
A) preceded
Q134: Which of the following does NOT represent
Q135: Which statement best describes one of the
Q136: The increase in oil prices that took
Q137: How has the price of oil generally
Q139: Why have oil shocks become less economically
Q140: In 1970, 1.3 barrels of oil produced
Q141: If an earthquake strikes, destroying a large
Q142: If nominal spending growth equals 6% and
Q143: In India, shocks to the weather:
A) do
Unlock this Answer For Free Now!
View this answer and more for free by performing one of the following actions

Scan the QR code to install the App and get 2 free unlocks

Unlock quizzes for free by uploading documents