Use the line graph to determine how many more hours were needed to prepare for Test 2 than for Test 1. 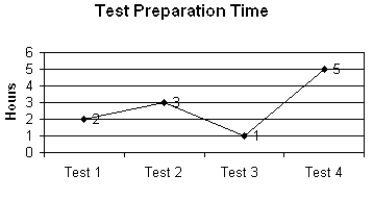
A) 2
B) 4
C) 3
D) 1
Correct Answer:
Verified
Q83: Use this graph to answer the question.
Q84: The bar graph below shows the percent
Q85: The test scores of 40 students
Q86: The bar graph below shows the percent
Q87: Accountants often use the median when studying
Q88: Find the mode for the amounts:$1187, $14,356,
Q89: The monthly net gains sales for a
Q90: The highway speeds of 100 cars
Q91: The owner of a small manufacturing plant
Q93: The circle graph below gives the inventory
Unlock this Answer For Free Now!
View this answer and more for free by performing one of the following actions

Scan the QR code to install the App and get 2 free unlocks

Unlock quizzes for free by uploading documents