Assume that the table below shows the age distribution of nurses in Great Britain in 1851. Make a histogram for the probability distribution.
A) 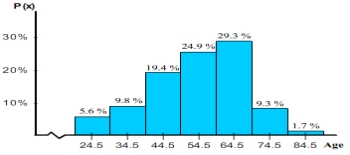
B) 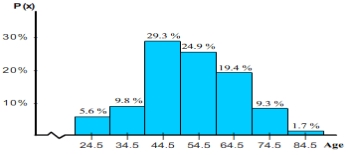
C) 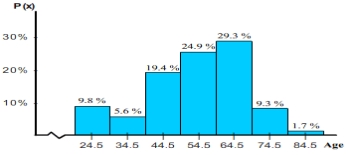
D) 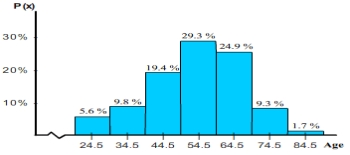
E) 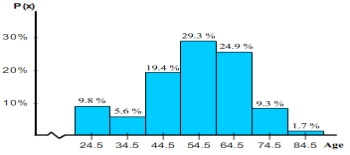
Correct Answer:
Verified
Q11: Richard has been given an 11-question multiple-choice
Q12: Jim has a 5-year-old car in
Q13: Give an example of a continuous random
Q14: Jim has a 5-year-old car in
Q15: Compute the standard deviation for ages
Q17: The Honolulu Advertiser stated that in
Q18: Jim has a 5-year-old car in
Q19: Give an example of a discrete random
Q20: The college hiking club is having
Q21: The probability of a radar station detecting
Unlock this Answer For Free Now!
View this answer and more for free by performing one of the following actions

Scan the QR code to install the App and get 2 free unlocks

Unlock quizzes for free by uploading documents