Assume that the following data represent baseball batting averages (multiplied by 1000) for a random sample of National League players near the end of the baseball season. The frequency table showing class limits, class boundaries, midpoints and frequency is given below. Draw a histogram.
A) 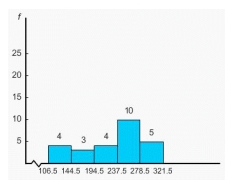
B) 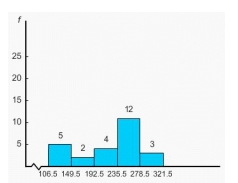
C) 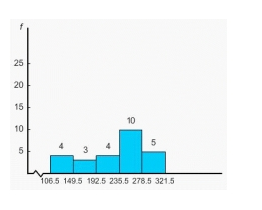
D) 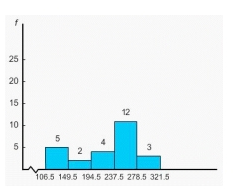
E)
Correct Answer:
Verified
Q1: Pyramid Lake, Nevada, is described as
Q2: Suppose the American Medical Association Center
Q3: Finish times (to the nearest hour)
Q4: Finish times (to the nearest hour)
Q6: Finish times (to the nearest hour)
Q7: At Westgate Community College, a survey was
Q8: It's not an easy life, but it's
Q9: Wetlands offer a diversity of benefits.
Q10: Finish times (to the nearest hour)
Q11: Finish times (to the nearest hour)
Unlock this Answer For Free Now!
View this answer and more for free by performing one of the following actions

Scan the QR code to install the App and get 2 free unlocks

Unlock quizzes for free by uploading documents