Given the following graphs, which graph represents fixed costs?
I 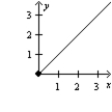 II
II 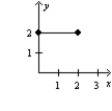 III
III 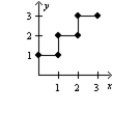
A) I
B) II
C) III
D) none of these
Correct Answer:
Verified
Q14: Assuming costs are represented on the vertical
Q16: As the volume of activity increases within
Q67: Rent of $10,000 paid per month for
Q68: When a cost behavior pattern does not
Q70: Fixed cost per unit is $7 when
Q73: The drivers that explain changes in costs
Q74: In a traditional cost management system, cost
Q75: Which of the following would be an
Q76: Knowledge of cost and activity-level relationship is
Q77: Cumulative average-time _ curve assumes the cumulative
Unlock this Answer For Free Now!
View this answer and more for free by performing one of the following actions

Scan the QR code to install the App and get 2 free unlocks

Unlock quizzes for free by uploading documents