Consider the following table and the line chart on the temperatures in 11 different states of the United States. 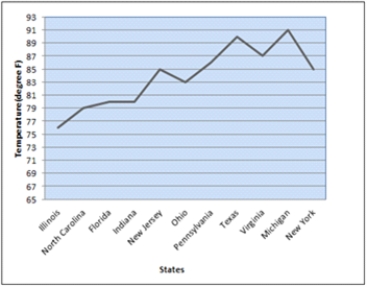
a. What are the problems with the layout and display of this line chart?
b. Create a new line chart for the given data. Format the chart to make it easy to read and interpret.
Correct Answer:
Verified
View Answer
Unlock this answer now
Get Access to more Verified Answers free of charge
Q22: The data dashboard for a marketing manager
Q23: In a business, the values indicating the
Q28: To avoid problems in interpreting the differences
Q29: To summarize and analyze data with both
Q32: An effective display of trend and magnitude
Q33: To generate a scatter chart matrix, we
Q33: A _ is useful for visualizing hierarchical
Q34: _ merges maps and statistics to present
Q37: The best way to differentiate chart elements
Q39: An alternative for a stacked column chart
Unlock this Answer For Free Now!
View this answer and more for free by performing one of the following actions

Scan the QR code to install the App and get 2 free unlocks

Unlock quizzes for free by uploading documents